@KJF239
I’m exploring your school resources. In exercise 5 I don’t understand what the numbers mean on the tree and I’m not sure of the purpose of the red line. Can you explain please?
@slduce
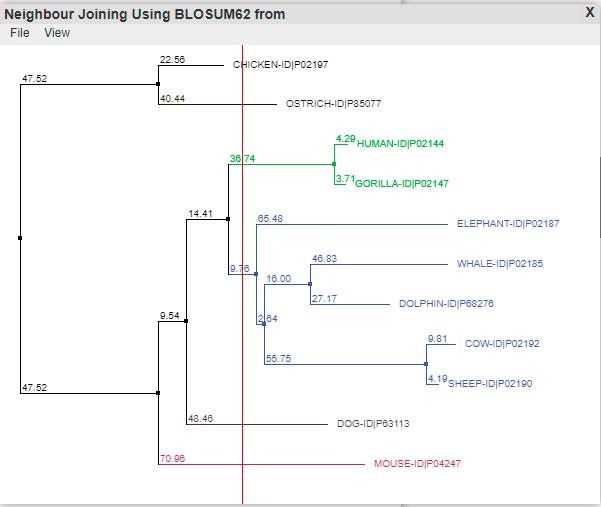
The tree reflects similarities between sequences. When you click the mouse cursor on the tree, the red line groups the sequences, each group has its own randomly generated colour. The numbers are distance scores that can be added, lower scores have greater similarity.
@KJF239
Thanks for trying to help me out but I’m none the wiser! Could you use an example from the picture above to explain how the numbers could be used with A level students who are new to this sort of thing?
@slduce
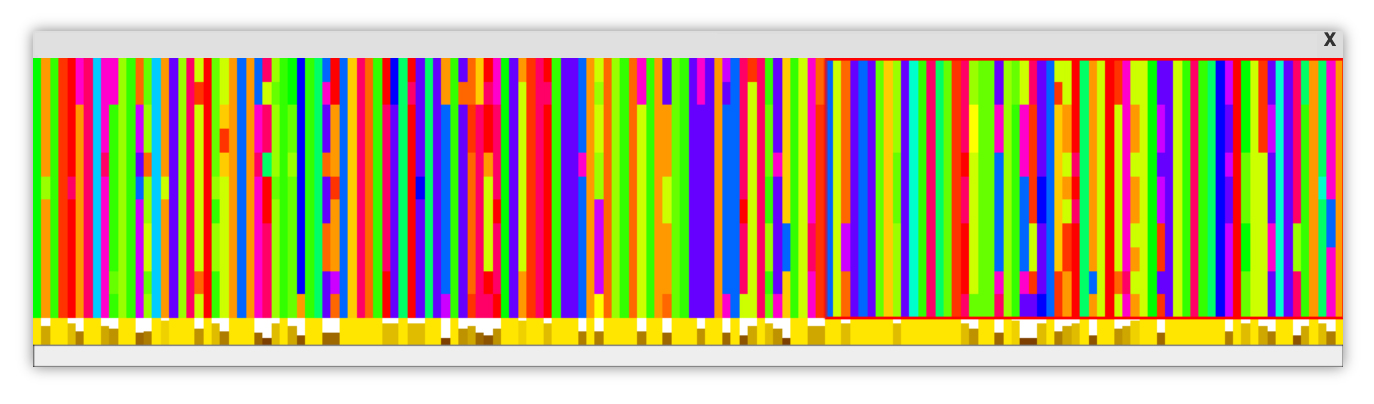
Open the overview window is another way to look at the differences. (Open from the View menu in the alignment window and select Overview Window). I used Taylor colour scheme.
@foreveremain
Hi! So the tree reflects the physicochemical similarities between the aligned protein sequences. The same protein in different species are rarely 100% identical, but conserve properties (hydrophobicity & polarity) important for maintining the protein’s 3D shape (its fold). (1/3)
You can see that sequences from Chicken & Ostrich, Human & Gorilla, Cow & Sheep all share a branch, so are grouped together. Clicking on the tree ‘cuts’ it with a red line, allowing the groups to be viewed on the alignment (and colours each one on the tree). (2/3)
The topology (pattern of branching) of this tree is a bit confusing, but makes sense when you look at the relationships between the species (I used the NCBI’s tool: https://ncbi.nlm.nih.gov/Taxonomy/CommonTree/wwwcmt.cgi): the line groups primates, and the artiodactyla (dolphin,whale,cow,sheep).
and that was the (3/3) - hope that helps you make more sense of the tree with your students!
Please note, the tree produced in Jalview is not a true evolutionary tree (that is, one which shows the evolutionary relationships among various biological species) rather it reflects similarities between the sequences in the alignment. It does this by counting up all the differences between the nucleotide bases, or amino acid residues (for proteins) in each of the columns of the alignment, between all pairs of aligned sequences. It should be noted that a consequence of this is the tree is only as accurate as the sequence alignment.
The numbers on the tree produced by Jalview are branch lengths, which also correspond to the length of the line shown for each branch. The smaller the number the more similar the sequences (and the shorter the branch). To measure the difference between two particular sequences in the tree, you simply add up the lengths of the branches along the shortest path between each sequence on the tree. For real evolutionary trees, you can also hypothesise about the evolutionary distance between a particular species and the ‘least recent common ancestor’ – each point where the tree splits into branches - defines the ‘most recent common ancestor’ of its branches, and so the left-most node is the most recent common ancestor of all the species in the tree.
Also, since the distances on the tree reflect the number of different nucleotides or residues in columns of the alignment, you can identify which columns contribute to the distances by looking at the consensus annotation row – which is a histogram shown below the sequence alignment. Columns that are conserved across all sequences have the same nucleotide bases/amino acid residues at that position, and the bar is shown at 100%. Shorter bars are shown for columns where different amino acids or bases appear in the same column.
One can visualise the different amino acids or bases for each column as a sequence logo. The logo can be added to the consensus annotation row by placing the mouse on the text consensus and right click the mouse to open context menu and select Show Logo.
Footnote:
If you are creating a figure, you can change the appearance of the tree by:
(i) Go to View menu and select Font, and change the font size, type etc.
(ii) For large trees, you might want to enable or disable ‘Fit to Window’ in the View menu
(iii) The ordering of branches on the tree can be changed by double clicking on the small black box at the junctions in the tree. Note - this doesn’t actually change the relationships shown by the tree at all – since those are described by how the branches connect with each other.
(iv) The image can be export from the File menu and select Save as and the type of image format required (PNG is good for powerpoint, EPS and SVG are good for printing – SVGs also work well for web pages).